Radiofrequency Radiation
Dosimetry Handbook

(Fourth Edition)


Chapter 4. Dielectric Properties

Information about the dielectric properties of biological systems is essential to RF dosimetry. This information is important in both experiments and calculations that include the interaction of electromagnetic fields with biological systems. This chapter describes the basic dielectric properties of biological substances and summarizes methods used to measure these properties; it includes a tabulated summary of the measured values.

4.1. CHARACTERISTICS OF BIOLOGICAL TISSUE

The material in this section was written by H. P. Schwan, Ph.D., Department of Bioengineering, University of Pennsylvania. It was published in a paper titled "Dielectric Properties of Biological Tissue and Physical Mechanisms of Electromagnetic Field Interaction" in Biological Effects of Nonionizing Radiation, ACS Symposium Series 157, Karl H. Illinger, Editor, published by the American Chemical Society, Washington, DC, 1981. It is presented here with minor changes by permission of the author and the publisher.

4.1.1. Electrical Properties

We will summarize the two electrical properties that define the electrical characteristics, namely, the dielectric constant relative to free space () and conductivity (). Both properties change with temperature and, strongly, with frequency. As a matter of fact, as the frequency increases from a few hertz to gigahertz, the dielectric constant decreases from several million to only a few units; concurrently, the conductivity increases from a few millimhos per centimeter to nearly a thousand.
Figure 4.1 indicates the dielectric behavior of practically all tissues. Two remarkable features are apparent: exceedingly high dielectric constants at low frequencies and three clearly separated relaxation regions--, , and --of the dielectric constant at low, medium, and very high frequencies. In its simplest form each of these relaxation regions is characterized by equations of the Debye type as follows,

Figure 4.1
Frequency dependence of the dielectric constant of muscle tissue (Schwan, 1975)
Dominant contributions are responsible for the , , and dispersions. They include for the -effect, apparent membrane property changes as described in the text; for the -effect, tissue structure (Maxwell-Wagner effect); and for the -effect, polarity of the water molecule (Debye effect). Fine structural effects are responsible for deviations as indicated by the dashed lines. These include contributions from subcellular organelles, proteins, and counterion relation effects.

(Equation 4.1)

where x is a multiple of the frequency and the constants are determined by the values at the beginning and end of the dispersion changes. However, biological variability may cause the actual data to change with frequency somewhat more smoothly than indicated by the equations.
The separation of the relaxation regions greatly aids in identifying the underlying mechanism. The mechanisms responsible for these three relaxation regions are indicated in Table 4.1. Inhomogeneous structure is responsible for the -dispersion--the polarization resulting from the charging of interfaces, i.e., membranes through intra- and extracellular fluids (Maxwell-Wagner effect). A typical example is presented in Figure 4.2 in the form of an impedance locus. The dielectric properties of muscle tissue are seen to closely conform to a suppressed circle, i.e. , to a Cole-Cole distribution function of relaxation times. A small second circle at low frequencies represents the -dispersion effect. Rotation of molecules having a permanent dipole moment, such as water and proteins, is responsible for the -dispersion (water) and a small addition to the tail of the -dispersion resulting from a corresponding 1dispersion of proteins. The tissue proteins only slightly elevate the high-frequency tail of the tissue's -dispersion because the addition of the1- effect caused by tissue proteins is small compared to the Maxwell-Wagner effect and occurs at somewhat higher frequencies. Another contribution to the -dispersion is caused by smaller subcellular structures, such as mitochondria, cell nuclei, and other subcellular organelles. Since these structures are smaller in size than the surrounding cell, their relaxation frequency is higher but their total dielectric increment smaller. They therefore contribute another addition to the tail of the -dispersion (1).

Table 4.1.
Electrical Relaxation Mechanism (Schwan, 1975)

Three categories of relaxation effects are listed as they contribute to gross and fine structure relaxational effects. They include induced-dipole effects (Maxwell-Wagner and counterion) and permanent-dipole effects (Debye).

Figure 4.2.
Dielectric properties of muscle in the impedance plane, with reactance X plotted against resistance R and the impedance Z = R + jX (Schwan, 1957). The large circle results from the -dispersion and the small one from the -dispersion. The plot does not include the -dispersion.

The -dispersion is due solely to water and its relaxational behavior near about 20 GHz. A minor additional relaxation ( ) between and -dispersion is caused in part by rotation of amino acids, partial rotation of charged side groups of proteins, and relaxation of protein-bound water which occurs somewhere between 300 and 2000 MHz.
The -dispersion is presently the least clarified. Intracellular structures, such as the tubular apparatus in muscle cells, that connect with the outer cell membranes could be responsible in tissues that contain such cell structures. Relaxation of counterions about the charged cellular surface is another mechanism we suggest. Last but not least, relaxational behavior of membranes per se, such as reported for the giant squid axon membrane, can account for the -dispersion (Takashima and Schwan, 1974). The relative contribution of the various mechanisms varies, no doubt, from one case to another and needs further elaboration.
No attempt is made to summarize conductivity data. Conductivity increases similarly in several major steps symmetrical to the changes of the dielectric constant. These changes are in accord with the theoretical demand that the ratio of capacitance and conductance changes for each relaxation mechanism is given by its time constant, or in the case of distributions of time constants, by an appropriate average time constant and the Kramers-Kronig relations.
Table 4.2 indicates the variability of the characteristic frequency for the various mechanisms--, , , and from one biological object to another. For example, blood cells display a weak -dispersion centered at about 2 kHz, while muscle displays a very strong one near 0.1 kHz. The -dispersion of blood is near 3 MHz, that of muscle tissue near 0.1 MHz. The considerable variation depends on cellular size and other factors. The variation may not be as strong in the -case as in the - and -dispersion frequencies. The -dispersion, however, is always sharply defined at the same frequency range.

Table 4.2.
Range of Characteristic Frequencies Observed With Biological Material for
-, -, -, and -Dispersion Effects

Table 4.3 indicates at what level of biological complexity the various mechanisms occur. Electrolytes display only the -dispersion characteristic of water. To the water's -dispersion, biological macromolecules add a -dispersion. It is caused by bound water and rotating side groups in the case of proteins, and by rotation of the total molecule in the case of the amino acids; in particular, proteins and nucleic acids add further dispersions in the - and -range as indicated. Suspensions of cells free of protein would display a Maxwell-Wagner -dispersion and the -dispersion of water. If the cells contain protein an additional, comparatively weak -dispersion due to the polarity of protein is added, and a -dispersion. If the cells carry a net charge, an -mechanism due to counterion relaxation is added; and if their membranes relax on their own as some excitable membranes do, an additional mechanism may appear.

Table 4.3.
Biological Components and Relaxation Mechanisms They Display (Schwan, 1975)

Evidence in support for the mechanism outlined above may be summarized as follows.

Water and Tissue Water--The dielectric properties of pure water have been well established from dc up to microwave frequencies approaching the infrared (Afsar and Hasted, 1977). For all practical purposes, these properties are characterized by a single relaxation process centered near 20 GHz at room temperature. Static and infinite frequency permittivity values are close to 78 and 5, respectively, at room temperature. Hence, the microwave conductivity increase predicted by Equation 4.1 is close to 0.8 mho/cm above 20 GHz, much larger than typical low-frequency conductivities of biological fluids which are about 0.01 mho/cm. The dielectric properties of water are independent of field strength up to fields of the order 100 kV/cm.
The dielectric properties of electrolytes are almost identical to those of water with the addition of a s term in Equation 4.1 due to the ionic conductance of the dissolved 
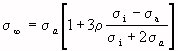
ion species. The static dielectric permittivity of electrolytes of usual physiological strength (0.15 N) is about two units lower than that of pure water (Hasted, 1963), a negligible change.
Three dielectric parameters are characteristic of the electrical and viscous properties of tissue water:
  1. The conductance of ions in water.
  2. The relaxation frequency, fc
  3. The static dielectric permittivity, s, observed at f << fc = 20 GHz
A detailed study of the internal conductivity of erythrocytes revealed the intracellular ionic mobility to be identical with that of ions in dilute electrolyte solutions if appropriate allowance is made for internal friction with suspended macromolecules (Pauly and Schwan, 1966). Tissue conductivities near 100 or 200 MHz, sufficiently high that cell membranes do not affect tissue electrical properties, are comparable to the conductivity of blood and to somewhat similar protein suspensions in electrolytes of physiological strength. Hence the mobility of ions in the tissue fluids apparently does not differ noticeably from their mobility in water.
Characteristic frequencies may be found from dielectric permittivity data or, even better, from conductivity data. The earlier data by Herrick at al. (1950) suggest that there is no apparent difference between the relaxation frequency of tissue water and that of the pure liquid (Schwan and Foster, 1966). However, these data extend only to 8.5 GHz, one-third the relaxation frequency of pure water at 37° C (25 GHz), so small discrepancies might not have been uncovered. We have made measurements on muscle at 37° C and 1° C (where the pure-water relaxation frequency is 9 GHz), up to 17 GHz. The dielectric properties of the tissue above 1 GHz show a Debye relaxation at the expected frequency of 9 GHz (Foster et al., 1980) (Figure 4.3). The static dielectric constant of tissue water as determined at 100 MHz compares with that of free water if allowance is made for the fraction occupied by biological macromolecules and their small amount of bound water (Schwan, 1957; Schwan and Foster, 1980). Thus from all points considered, tissue water appears to be identical with normal water.

Figure 4.3.
Dielectric properties of barnacle muscle in the microwave frequency range are presented in the complex dielectric constant plane (Foster et al., 1980).
' and " = /o are the components of the complex dielectric constant r = ' - j". The frequency at the peak of the circle is the characteristic frequency of the dispersion and identical with that of normal water, demonstrating the identity of tissue water in normal water from a dielectric point of view.

Protein Solutions--The dielectric properties of proteins and nucleic acids have been extensively reviewed (Takashima, 1969; Takashima and Minikata, 1975). Protein solutions exhibit three major dispersion ranges. One occurs at RF's and is believed to arise from molecular rotation in the applied electric field. Typical characteristic frequencies range from about 1 to 10 MHz, depending on the protein size. Dipole moments are of the order of 200-500 Debyes, and low-frequency increments of dielectric permittivity vary between 1 and 10 units/g protein per 100 ml of solution. The high-frequency dielectric permittivity of this dispersion is lower than that of water because of the low dielectric permittivity of the protein, leading to a high-frequency decrement of the order of 1 unit/g protein per 100 ml. This RF dispersion is quite noticeable in pure protein solutions, but it contributes only slightly to the large -dispersion found in tissues and cell suspensions.
At microwave frequencies the dielectric properties of tissues are dominated by the water relaxation centered near 20 GHz. The magnitude of this water dispersion in tissues is typically diminished by some 20 dielectric units, due to the proteins which displace a corresponding volume of water.
Between these two readily noticeable dispersions is a small one, termed the -dispersion by Grant. It was first noted for hemoglobin (Schwan, 1965b) and then carefully examined for hemoglobin (Pennock and Schwan, 1969) and albumin (Grant et al., 1968). This dispersion is characterized by a fairly broad spectrum of characteristic frequencies extending from some hundred to some thousand megahertz. Its magnitude is considerably smaller than that of the other two dispersions, and it is thought to be caused by a corresponding dispersion of protein-bound water and/or partial rotation of polar subgroups.
Grant (1979) and Schwan (1977b) pointed out that the conductivity of protein-bound water is higher than that of water and electrolytes in the frequency range from ~500 to ~2000 MHz. Grant has suggested that this might establish a local interaction mechanism of some biological significance.
Dielectric saturation for proteins can be predicted from the Langevin equation and occurs in the range of 10 to 100 kV/cm. Indeed, onset of saturation has been experimentally observed in PBLG (poly--benzyl-L-glutamate) at 50 kV/cm (Jones et al., 1969), which is in good agreement with the Langevin estimate. Any irreversible changes in protein structure that accompany its rotational responses to an electrical field are unlikely to occur at field levels smaller than required for complete orientation, i.e., dielectric saturation. The thermal energy kT (where k is the Boltzmann constant, and T the absolute temperature) is in this case greater than the product E (where is the dipole moment, and E the field strength), representing the change in potential energy that occurs with rotation. Thus changes in protein structure caused by nonsaturating electric fields would probably occur spontaneously in the absence of any exciting field at normal temperatures.
Illinger (1977) has discussed the possibilities of vibrational and torsional substructural effects at microwave or millimeter-wave frequencies. A calculation of internal vibrations in an alanine dipeptide in water, using a molecular dynamics approach, has been presented by Rossky and Karplus (1979). In this model the lowest frequency internal oscillations that occur (dihedral angle torsions at 1500 GHz) are strongly damped; large proteins might exhibit lower frequency internal vibrations. We would expect any macromolecular vibration that displaces surrounding water to be overdamped by the water medium, which is quite lossy at frequencies below 100 GHz; however, a detailed analysis of the response of such a resonator surrounded by a lossy medium has not yet been applied to this case. Illinger has not discussed the field strengths required to saturate submolecular vibrational transitions, but the Langevin equation predicts that saturation for smaller polar units requires higher field-strength values (Froehlich, 1949). Thus we would expect that biologically critical field strengths are, for the various modes suggested by Illinger, probably well above the levels required by the Langevin equation for the complete rotational orientation of the total molecules.
In summary, the dielectric properties of proteins and biopolymers have been investigated extensively. For the rotational process, the field saturation levels are rather high; perhaps even higher for internal vibrational and torsional responses. For nonlinear RF responses due to counterion movement and chemical relaxation, the levels are unknown but probably also high. In all these processes, reversible polarizations occur in competition with large thermal energies, and irreversible changes are not expected at field-strength levels of the order of a few volts per centimeter.

Membranes--Membranes are responsible for the dielectric properties of tissues and cell suspensions at RF's, as demonstrated by studies involving cell suspensions. Yeast, blood, bacteria, pleuropneumonia-like organisms, vesicles, and cellular organelles have been extensively investigated by many investigators, including Fricke (1923), Cole (1972), and Schwan (1957). This work has led to a detailed understanding of the role of cell membranes in the polarization processes of biological media in the RF range. (The relatively simple geometrical shapes of cells in suspensions facilitated this understanding.) The principal mechanism for dielectric polarization at RF's and below is the accumulation of charges at membranes from extra- and intracellular fluids. For spherical particles, the following expressions were derived (Schwan, 1957):

(Equation 4.2)

(Equation 4.3)

(Equation 4.4)

for the limit values of the simple dispersion that characterizes the frequency dependence. The time constant is

(Equation 4.5)

In these equations, Cm and G m are capacitance and conductance per square centimeter of the cell membrane; R is the cell radius; is the cellular volume fraction, and i = 1/ i and a = l/ a are the conductivities of the cell interior and suspending medium. The equations apply for small-volume fractions, , and assume that the radius of the cell is very large compared with the membrane thickness. More elaborate closed-form expressions have been developed for cases when these assumptions are no longer valid (Schwan and Morowitz, 1962; Schwan et al., 1970), and an exact representation of the suspension dielectric properties as a sum of two dispersions is available (Pauly and Schwan, 1959). If, as is usually the case, the membrane conductance is sufficiently low, Equations 4.2-4.5 reduce to the simple forms to the right of the arrows.

Figure 4.4
Equivalent circuit for the -dispersion of a cell suspension and corresponding plot in the complex dielectric constant plane (Schwan and Foster, 1980).

A physical insight into Equations 4.2-4.5 is gained by considering the equivalent circuit shown in Figure 4.4, which displays the same frequency response defined in these equations. The membrane capacitance per unit area, Cm, appears in series with the access impedance, i + a/2, while the term a (1-1.5 ) provides for the conductance of the shunting extracellular fluid. Hence, the time constant, , which determines the frequency where the impedances 1/CmR and (i + a/2) are equal is given as Equation 4.5. Using typical values of i, a ~ 0.01 mho/cm, Cm = 1 F/cm2, R = 10 m, and = 0.5, with Equations 4.2-4.5 we see that the dispersion must occur at RF's and that its magnitude, s - , is exceptionally high.
From experimental dispersion curves and hence values of the four quantities s, ,
(s - ), and , the three quantities Cm, i, and a, can be determined with an additional equation available to check for internal consistency. Values for extracellular and intracellular resistivities thus obtained agree well with independent measurements. Dispersions disappear as expected after destroying the cell membranes, and their characteristic frequencies are readily shifted to higher or lower frequencies as intracellular or extracellular ionic strengths are experimentally changed. This gives confidence in the model, whose validity is now generally accepted.
This work led to the important conclusion that the capacitance of all biological membranes, including cellular membranes and those of subcellular organelles such as mitochondria, is of the order of 1 F/cm2. This value is apparently independent of frequency in the total RF range; at low audio frequencies, capacitance values increase with decreasing frequencies due to additional relaxation mechanisms in or near the membranes. These mechanisms will not be discussed here and have been summarized elsewhere (Schwan, 1957; Schwan, 1965a).
From the membrane capacitance, we can estimate values for the transmembrane potentials induced by microwave fields. At frequencies well above the characteristic frequency (a few MHz), the membrane-capacitance impedance becomes very small by comparison with the cell-access impedance (i + a/2) , and the membrane behaves electrically like a short circuit. Since intracellular and extracellular conductivities are comparable, the average current density through the tissue is comparable to that in the membrane. For an in situ field of 1 V/cm (induced by an external microwave-field flux of about 10 mW/cm²), the current density, i, through the membrane is about 10 mA/cm² since typical resistivities of tissues are of the order of 100 -cm at microwave frequencies. Thus the evoked membrane potential, V = i/jCm, is about 0.5 V at 3 GHz and diminishes with increasing frequency. This value is 1000 times lower than potentials recognized as being biologically significant. Action potentials can be triggered by potentials of about 10 mV across the membrane, but (dc) transmembrane potentials somewhat below 1 mV have been recognized as being important (Schmitt et al., 1976).
If f < < fc, the total potential difference applied across the cell is developed across the membrane capacitance. In this limit, the induced membrane potential, V, across a spherical cell is V = 1.5 ER, where E represents the applied external field. Thus the cell samples the external-field strength over its dimensions and delivers this integrated voltage to the membranes, which is a few millivolts at these low frequencies for cells larger than 10 m and external fields of about 1 V/cm. These transmembrane potentials can be biologically significant.


Go to Chapter 4.1.2

Return to Table of Contents.

Last modified: June 24, 1997
© October 1986, USAF School of Aerospace Medicine, Aerospace Medical Division (AFSC), Brooks Air Force Base, TX 78235-5301